SEO Reporting Dashboard (2026): Metrics, Layout, and Automation
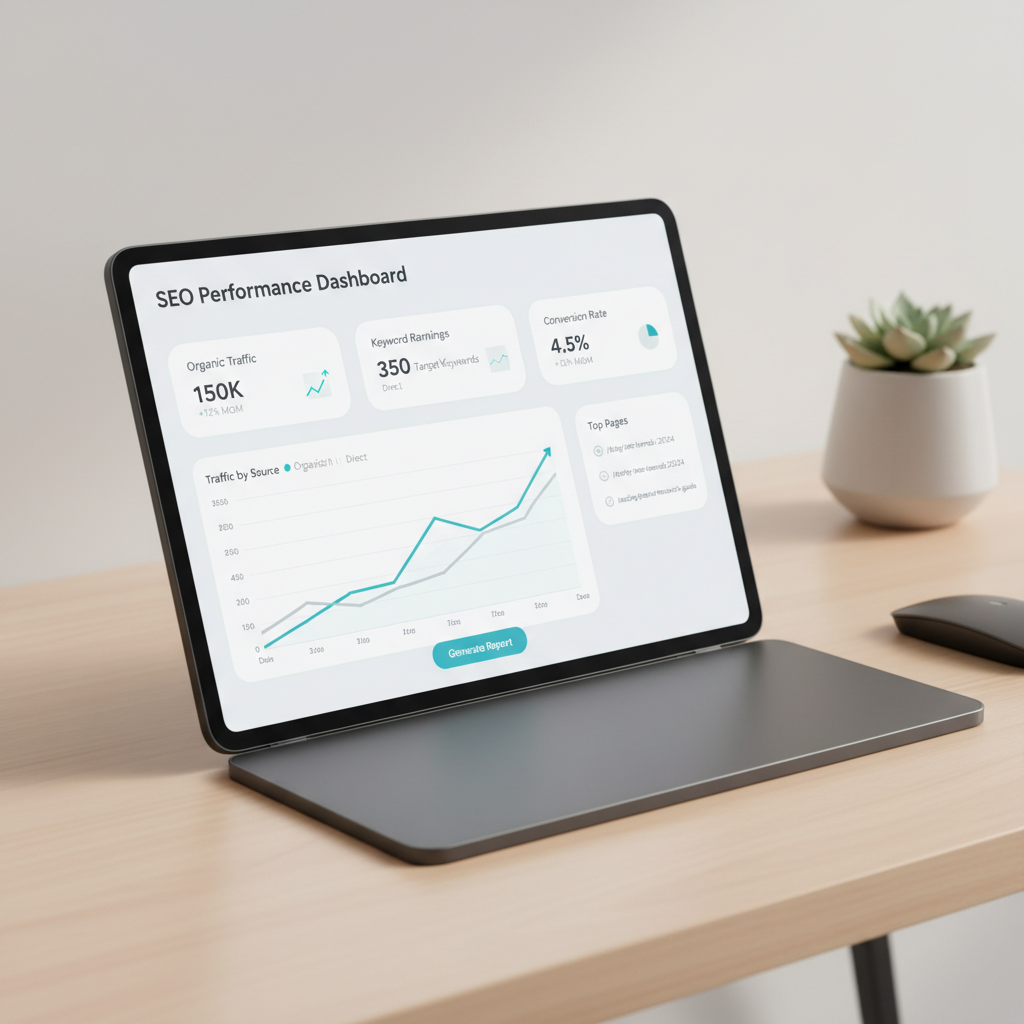
An SEO performance dashboard combines data from Google Search Console, Google Analytics 4, and crawler tools into a single visual reporting hub. Instead of switching across five tabs to diagnose traffic drops, you view rank tracking, click-through rates, technical health, and conversions side by side. Setting up this unified view helps you spot issues fast, whether you build a custom dashboard in Looker Studio or use an automated platform.
How to build an seo performance dashboard that cuts the noise
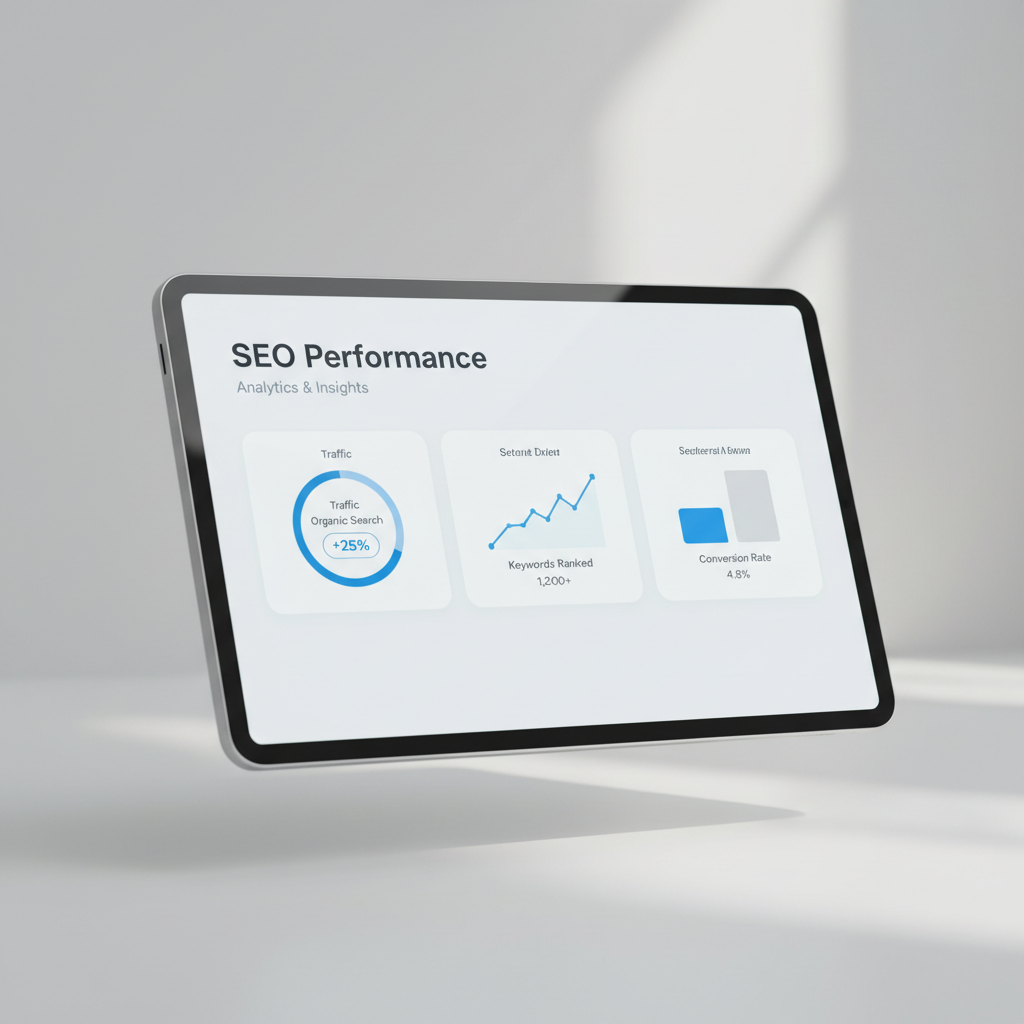
Most default reports fail because they isolate metrics. You see organic sessions drop, but you cannot tell if a spike in 404 errors, broken redirects, or a drop in referring domains caused the decline without opening separate tools. A structured SEO dashboard fixes this problem by displaying technical site health directly beneath organic traffic and conversion trends.
If your team publishes large batches of content, tracking indexing speed and early query gains is critical. You can configure Google Search Console monitoring for AI-published SEO content to evaluate whether new URLs earn impressions in search results or sit unindexed.
Looker Studio lets you blend organic search metrics with revenue data, but you must configure it properly to avoid API quota errors. Aligning your keywords with revenue helps you distinguish high-converting search queries from high-bounce traffic.
TL;DR: An SEO performance dashboard consolidates search metrics, technical health, and analytics into one unified view. By connecting Google Search Console and GA4 into Looker Studio or automated tools like seobase, you can track organic growth, spot traffic drops early, and make data-driven content decisions.
On this page
Essential reports to include in your core setup
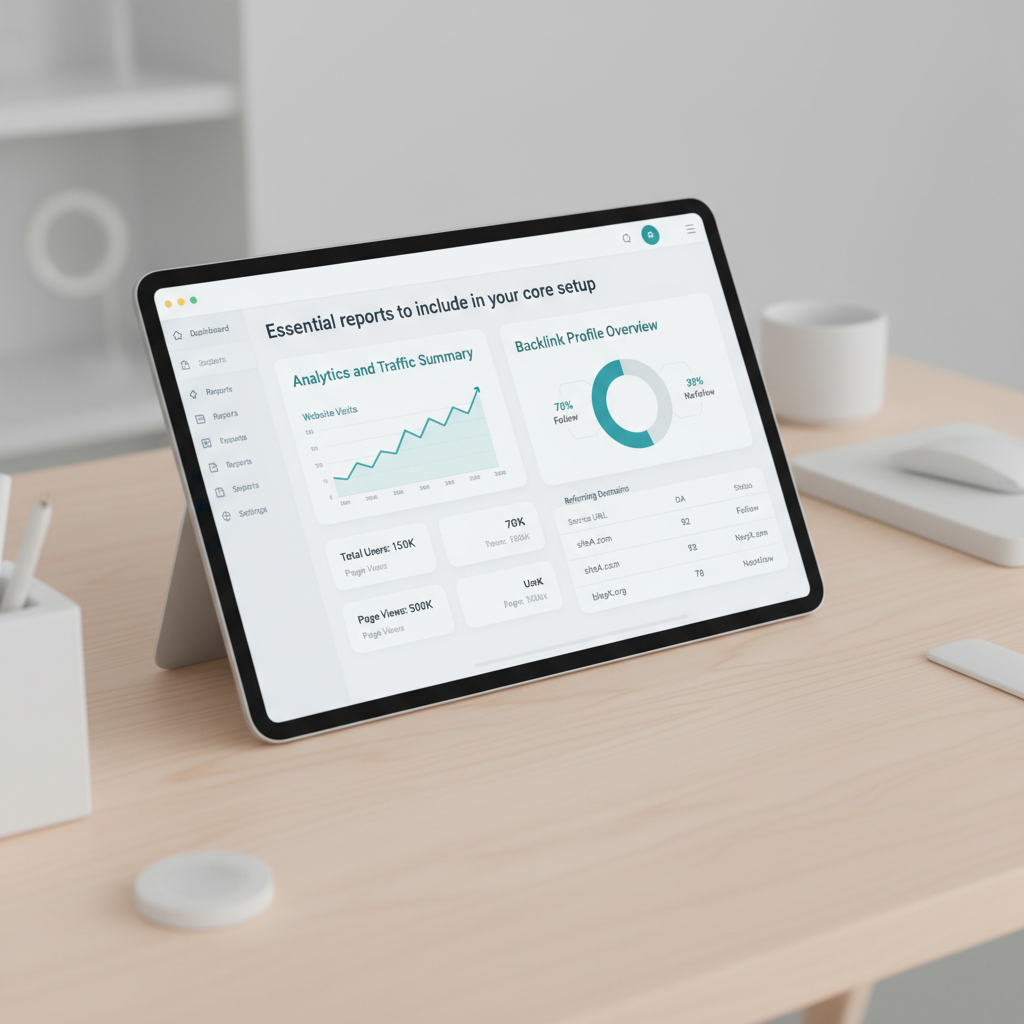
Three reporting layers form the foundation of any reliable SEO setup. When you omit one, you miss key diagnostic context. Treat these three views as your primary baseline before building advanced visualizations.
Analytics and traffic summary
Import your Google Analytics 4 property into a focused traffic panel. Track sessions, engaged sessions, engagement rate, bounce rate, and conversion events on a single screen.
Traffic volume alone can mislead your team. If blog sessions increase significantly but conversion counts remain flat, visitors may lack purchase intent. Pairing organic session volume directly with conversion events tells you whether your search visibility generates business pipeline.
Backlink profile overview
This section monitors total backlinks, referring domains, domain trust scores, and anchor text distribution. Look at trend lines over 30, 90, and 180 days rather than isolated daily counts. Consistent domain growth indicates expanding authority, while an unexpected spike of hundreds of spammy foreign-language links points to potential link spam or scraper activity.
Tracking lost backlinks is equally critical. If your top-converting landing page loses referring domains from authoritative industry publications, its keyword rankings usually drop shortly after.
Website audit overview
Place technical health metrics directly below your traffic data. This report tracks HTTP 404 status codes, 5xx server errors, redirect chains, and missing canonical tags. A single broken redirect on a high-performing URL can quickly wipe out both search rankings and organic revenue.
Include Core Web Vitals metrics in this view. Keep Largest Contentful Paint (LCP) under 2.5 seconds, Interaction to Next Paint (INP) under 200 milliseconds, and Cumulative Layout Shift (CLS) under 0.1. Slow pages damage conversion rates and reduce search engine crawl efficiency.
Stacking these three views together creates an operational dashboard instead of a cluttered folder of spreadsheets.
Step-by-step blueprint for a unified Looker Studio layout
Connect your native data sources
Open Looker Studio and add Google Search Console and Google Analytics 4 using Google’s free native connectors. These direct connections do not require third-party subscription tools.
For Search Console, select the Site Impression table to review site-wide trends, and add a second data source using the URL Impression table for page-level performance. Note that Search Console retains data for 16 months, so set up a BigQuery export if you require multi-year historical tracking.
Blend for conversion insights
Looker Studio allows you to join data from two different sources using a common dimension. Join your Google Search Console URL Impression data with GA4 session data using the clean landing page path as your join key.
Join Configuration:
- Left Data Source: Google Search Console (URL Impression)
- Right Data Source: Google Analytics 4
- Join Type: Left Outer Join
- Join Condition: GSC Landing Page == GA4 Landing Page + Query String
This joined dataset attributes newsletter signups, lead forms, and purchase events to specific organic landing pages and search queries. If you need a structured framework to map these metrics to business goals, follow this SEO strategy template.
Organize by content lifecycle
Do not place every URL into one unorganized table. Segment your reporting layout based on content age:
- New Content (0 to 90 days): Track indexation speed and early impression growth as search engines evaluate new pages.
- Evergreen Content (90 to 365 days): Monitor steady rank positions, click-through rates, and conversion numbers.
- Decaying Content (365+ days): Flag pages with rolling 90-day declines in organic clicks to queue them for content refreshes.
Build the visual hierarchy
Structure your dashboard pages logically. Place high-level scorecards (total organic clicks, organic sessions, total conversions, and average rank) across the top row.
Place time-series charts showing 12-month traffic trends in the middle section. Position detailed query-level tables, URL breakdowns, and technical crawl health tables at the bottom. This layout lets stakeholders digest top-line results immediately before reviewing granular URLs.
Advanced metrics for multi-project management and agencies
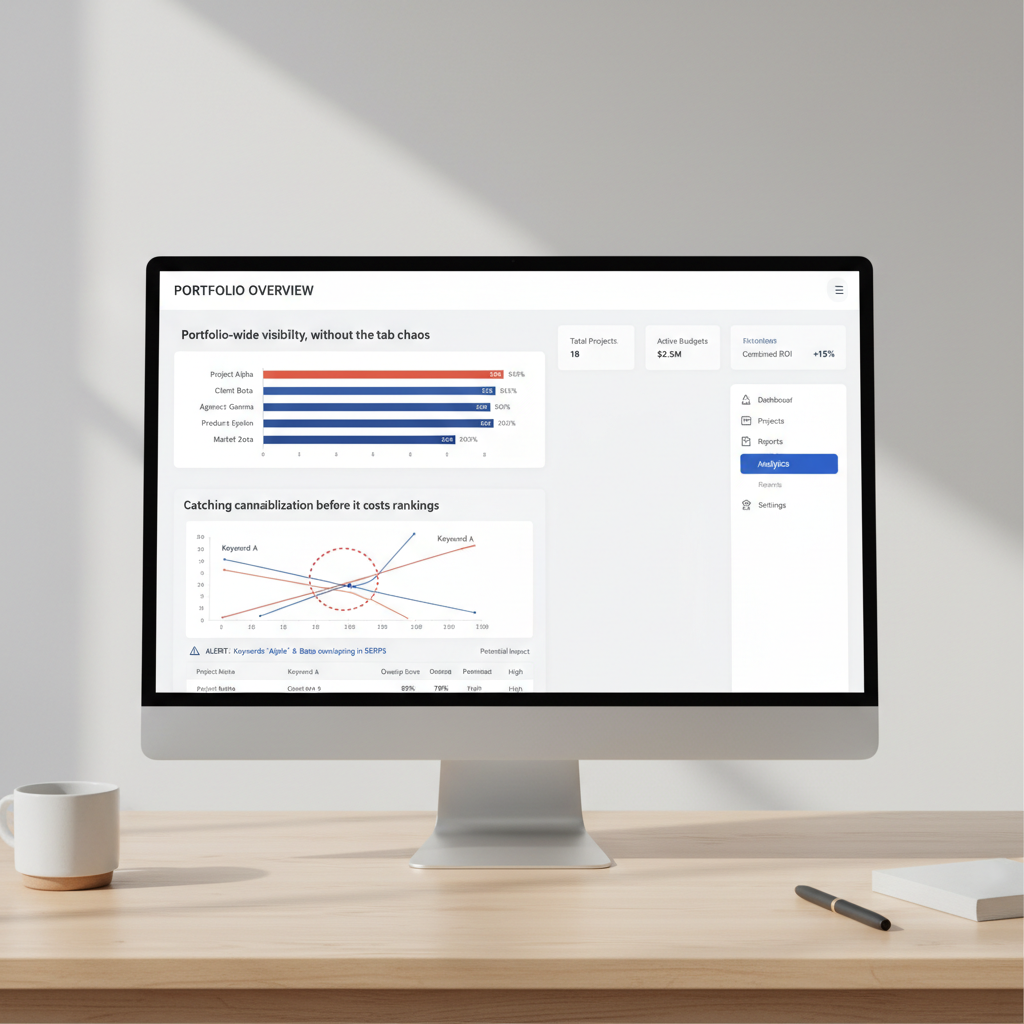
Managing 30 client properties requires a different reporting architecture than managing a single website. A multi-project view aggregates performance metrics across all domains onto a single screen, eliminating the need to inspect individual properties daily.
Portfolio-wide visibility, without the tab chaos
A centralized portfolio view tracks visibility scores, net keyword gains, and week-over-week traffic changes across every managed account. When three unrelated client sites drop in organic clicks during the same week, you can quickly determine whether a broad Google search algorithm update rolled out across that specific industry.
Catching cannibalization before it costs rankings
A keyword cannibalization matrix highlights instances where multiple URLs on the same domain compete for identical search queries. For example, an e-commerce website might have a collection page and an informational blog post alternating rankings for a valuable commercial keyword.
This internal competition splits backlink equity and lowers the rank potential of both URLs. Run an automated monthly query-to-page mapping filter to identify cannibalizing URLs, then consolidate the content using 301 redirects or adjust internal anchor text.
Intent mismatches and crawl budget on enterprise sites
Websites with more than 50,000 indexable URLs face specific crawl efficiency challenges. Enterprise dashboards should monitor crawl budget utilization alongside search intent matching.
Enterprise Dashboard Checklist:
1. Googlebot crawl requests per day vs. server response times (ms)
2. Ratio of 200 OK responses to 3xx, 4xx, and 5xx status codes
3. Non-indexed URLs discovered vs. successfully indexed pages
4. Search intent mismatch flags (high bounce rate + low time on page on commercial queries)
Track server response times in Google Search Console’s Crawl Stats report. If average response times exceed 500 milliseconds, Googlebot frequently slows its crawl rate, leaving new or updated URLs unindexed.
Setting up anomaly detection and automated alerts
Manual weekly checks often miss critical technical failures. Automated anomaly alerts notify your team within hours when site migrations, code deployments, or server issues disrupt search visibility.
Slack alerts for sudden clicks or impressions drops
Because Google Search Console lacks native webhooks for chat applications, use a Google Apps Script or a scheduled BigQuery query to check daily search metrics. Calculate a rolling 7-day average of impressions and clicks.
Configure your script to fire an automated webhook to a Slack channel when daily clicks drop by more than 20% compared to the 7-day average. This alert catches broken site deployments and accidental noindex tags before significant traffic is lost.
Email alerts for Core Web Vitals and indexing errors
Configure Google Search Console to email administrators immediately when new “Page indexing” or “Coverage” issues arise, especially sudden spikes in “Server error (5xx)” or “Excluded by ‘noindex’ tag.”
Pair GSC notifications with automated performance monitoring through the Chrome User Experience Report (CrUX) API or PageSpeed Insights API. Send alert emails if 75th percentile LCP scores exceed the 2.5-second threshold on core revenue templates.
Separating algorithm updates from seasonal swings
Traffic dips do not always indicate search penalties or technical bugs. B2B software websites consistently see lower search activity in late December, while consumer retail traffic peaks in November.
Compare current performance against the exact same 30-day window from the prior year. If year-over-year search trends remain stable while month-over-month clicks decline, the change is seasonal. If year-over-year clicks plunge unexpectedly, review Google’s official Search Status Dashboard to see if the drop matches an active search ranking update.
Comparing custom dashboards with all-in-one platforms
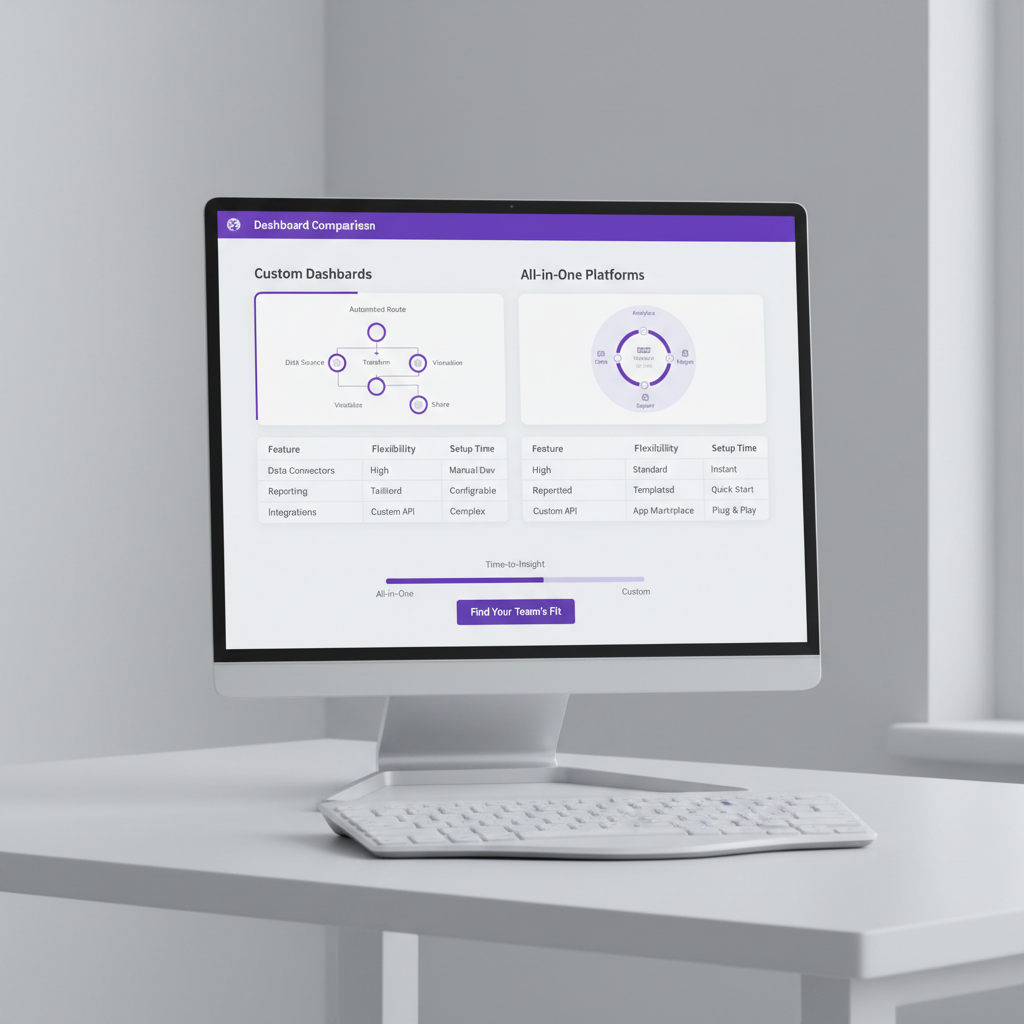
Looker Studio offers extensive flexibility. It allows you to build custom calculations, apply precise brand styling, and combine private CRM database extracts with organic search metrics.
However, custom Looker Studio builds require active maintenance. The standard Search Console connector enforces an API limit of 1,200 queries per minute, which can throw error messages on complex dashboards. When third-party connectors update schema fields or authentication tokens expire, reports break until formulas are manually repaired.
The automated route
Dedicated platforms like seobase eliminate manual connector configurations. They automatically sync keyword ranking positions, backlink counts, and content indexing status within a unified platform.
Instead of merely presenting static charts, integrated platforms connect performance insights directly to content execution. When a keyword rank drops, you can update and republish the content directly through connected CMS integrations.
Which one fits your team?
Choose Looker Studio if your primary requirement is presenting custom-branded visual reports to external executive stakeholders.
Choose an automated platform if your priority is managing keyword research, content production, and rank tracking in one continuous workflow without managing API limits and spreadsheet scripts.
| Feature | Looker Studio | seobase |
|---|---|---|
| Setup Time | 4 to 8 hours (Manual) | Under 10 minutes |
| Data Blending | Highly flexible (SQL / Joins) | Standard pre-configured views |
| Maintenance | High (Connector breaks) | Zero (Fully managed) |
| API Limitations | Subject to GSC / GA4 quotas | Managed background polling |
| Primary Use | Executive and client reporting | Content strategy and execution |
Building a smarter workflow for ongoing organic growth
Fragmented data creates operational delays. Consolidating your search metrics into an accessible dashboard ensures that technical SEO improvements connect directly to business performance.
Connect your data sources
A functional reporting environment connects search visibility directly to commercial results:
- Organic Search vs. Revenue: Track organic sessions alongside goal completions and pipeline value.
- Technical Health vs. Retention: Display Core Web Vitals metrics adjacent to bounce and conversion rates.
- Link Acquisition vs. Rank Velocity: Map new referring domains against top-10 keyword gains over 90-day intervals.
Evaluating these data points in one view reveals root causes. When page load times improve by 1.2 seconds on key product pages, you can immediately track the corresponding uplift in organic conversion rates.
Your first move
Audit your current reporting workflow. Remove cluttered reports that bury key performance indicators behind complex sub-menus.
Connect Google Search Console and GA4 into a single Looker Studio view or deploy an automated platform like seobase. Bringing your organic metrics into one command center allows you to identify traffic drops quickly and scale search visibility efficiently.
Frequently asked questions
What is an seo performance dashboard?
An SEO performance dashboard is a reporting interface that gathers organic search metrics, keyword rankings, technical health checks, backlink profiles, and revenue data into a single visual view to track search performance.
What metrics should be included in an seo reporting dashboard?
A complete dashboard should display organic clicks, impressions, average click-through rate, keyword position movements, organic conversion rates, referring domain trends, crawl errors (4xx/5xx), and Core Web Vitals metrics (LCP, INP, CLS).
How do you connect Google Search Console to an seo dashboard?
In Looker Studio, click “Add data,” select the native Google Search Console connector, and authorize your account. Choose your web property, pick the “Site Impression” or “URL Impression” table, and click “Add” to start building charts without middleware fees.
What is the difference between an seo audit dashboard and an seo KPI dashboard?
An SEO audit dashboard focuses on site health metrics such as broken status codes, missing canonicals, crawl errors, and page speed benchmarks. An SEO KPI dashboard tracks business outcomes, including organic traffic volume, keyword ranking changes, lead generation, and attributable revenue.
How often should an seo dashboard be updated?
Dashboard metrics should refresh daily to catch indexing errors and ranking drops quickly. Strategic reviews of content performance, conversion rates, and backlink velocity should take place monthly.
What core tools are needed to build a custom seo performance dashboard?
Building a custom dashboard requires Google Search Console for search query data, Google Analytics 4 for user behavior and conversions, a website crawler for technical health data, and a visualization platform such as Looker Studio or Power BI.
How do you track the business impact of seo within a dashboard?
Track business impact by joining organic landing page sessions with conversion events, form submissions, and e-commerce transaction values in GA4. This workflow demonstrates clear revenue generation from organic search beyond standard keyword rank positions.
Put this on autopilot
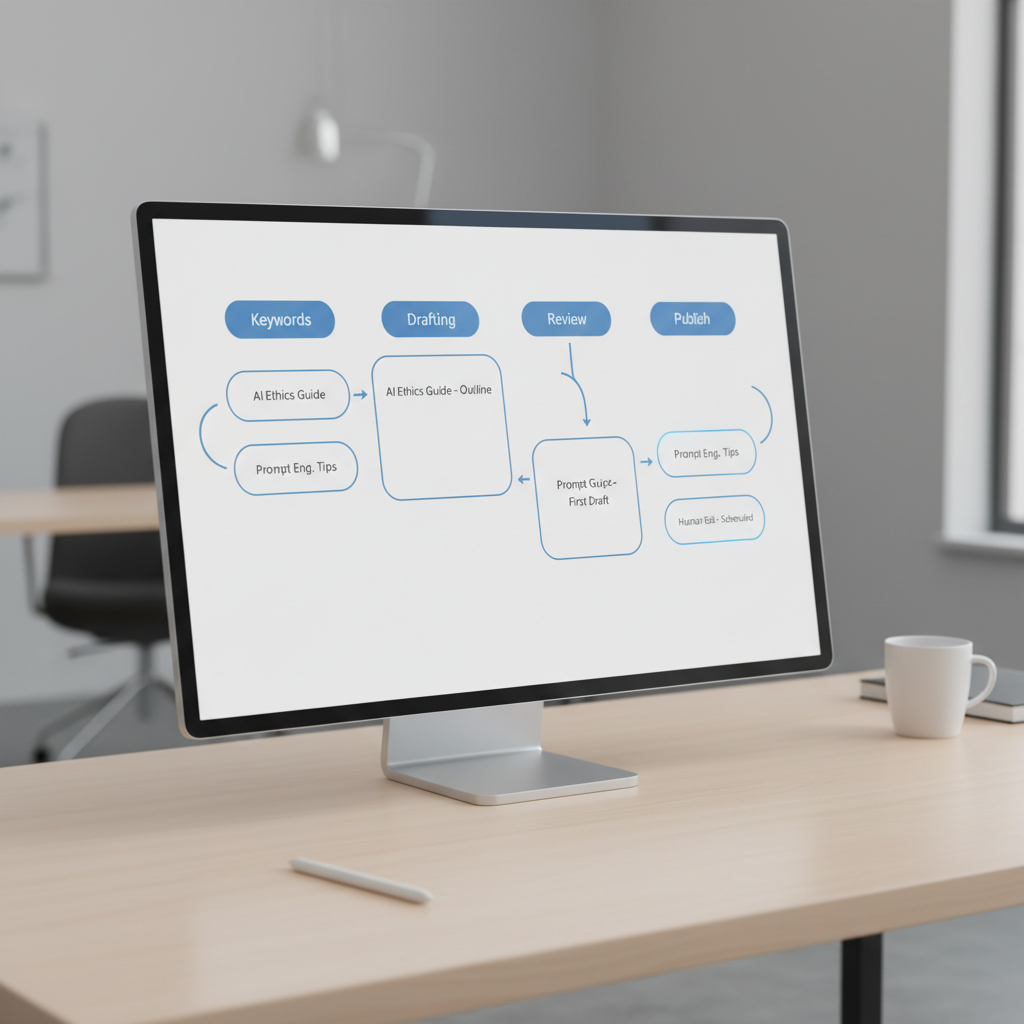
Seobase runs the whole loop for you: it finds the keywords worth ranking for, writes and publishes the articles, and reports back from Search Console on what actually moved.
Start a free Seobase workflowIn this guide
- How to build an seo performance dashboard that cuts the noise
- Essential reports to include in your core setup
- Step-by-step blueprint for a unified Looker Studio layout
- Advanced metrics for multi-project management and agencies
- Setting up anomaly detection and automated alerts
- Comparing custom dashboards with all-in-one platforms
- Building a smarter workflow for ongoing organic growth
- Frequently asked questions