SEO analytics reporting: cut vanity metrics and track real pipeline growth
Traditional traffic charts look great in a slide deck, but they rarely show actual business revenue. Upgrading your SEO analytics reporting proves real pipeline impact. Standard dashboards track raw clicks and keyword ranks, yet they miss whether those visitors ever turn into paying customers.
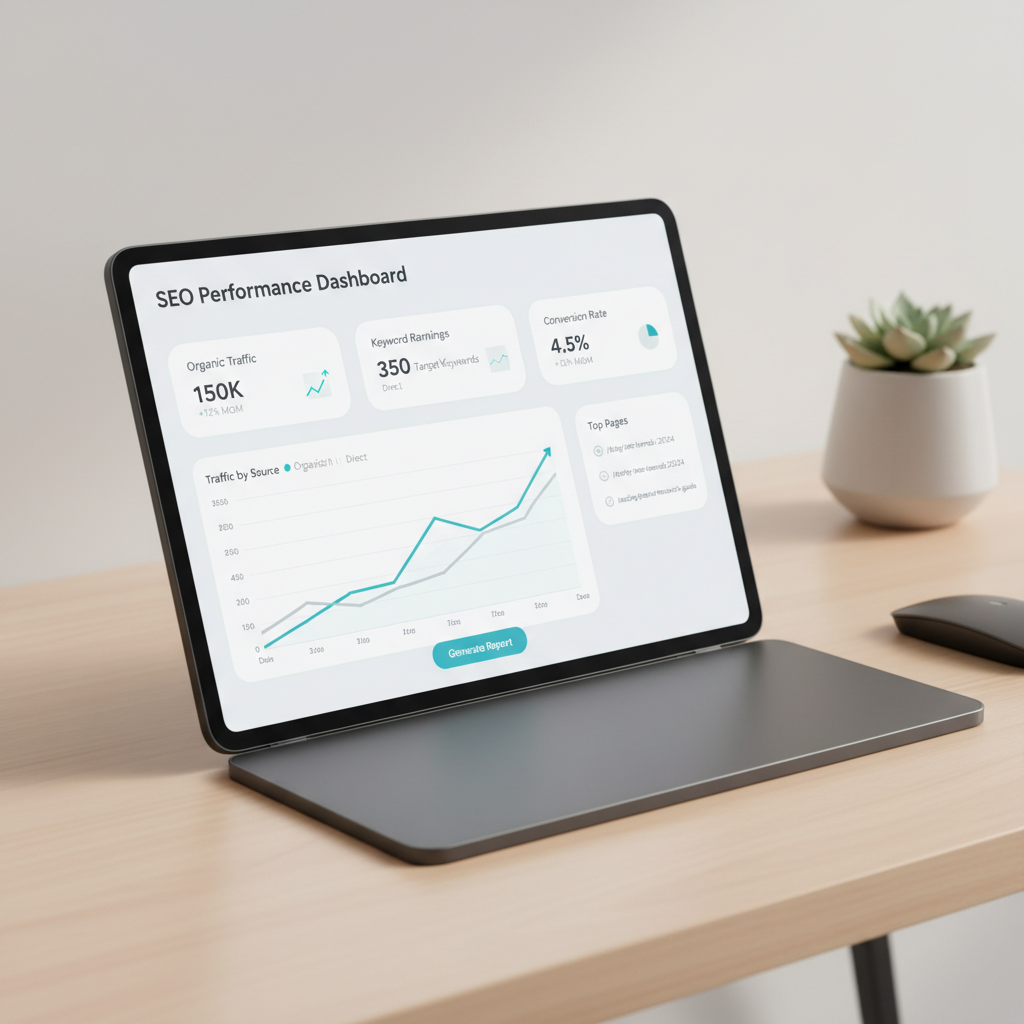
This guide walks through the exact workflow needed to turn raw SEO data into bottom-line revenue without relying on generic views.
TL;DR: Effective seo analytics reporting requires moving past vanity metrics like raw domain authority. Instead, combine data from google and specialized seo analytics tools into real-time seo reporting dashboards that tie organic traffic directly to revenue, assisted conversions, and pipeline growth.
Cutting vanity metrics to focus on Full SEO intelligence
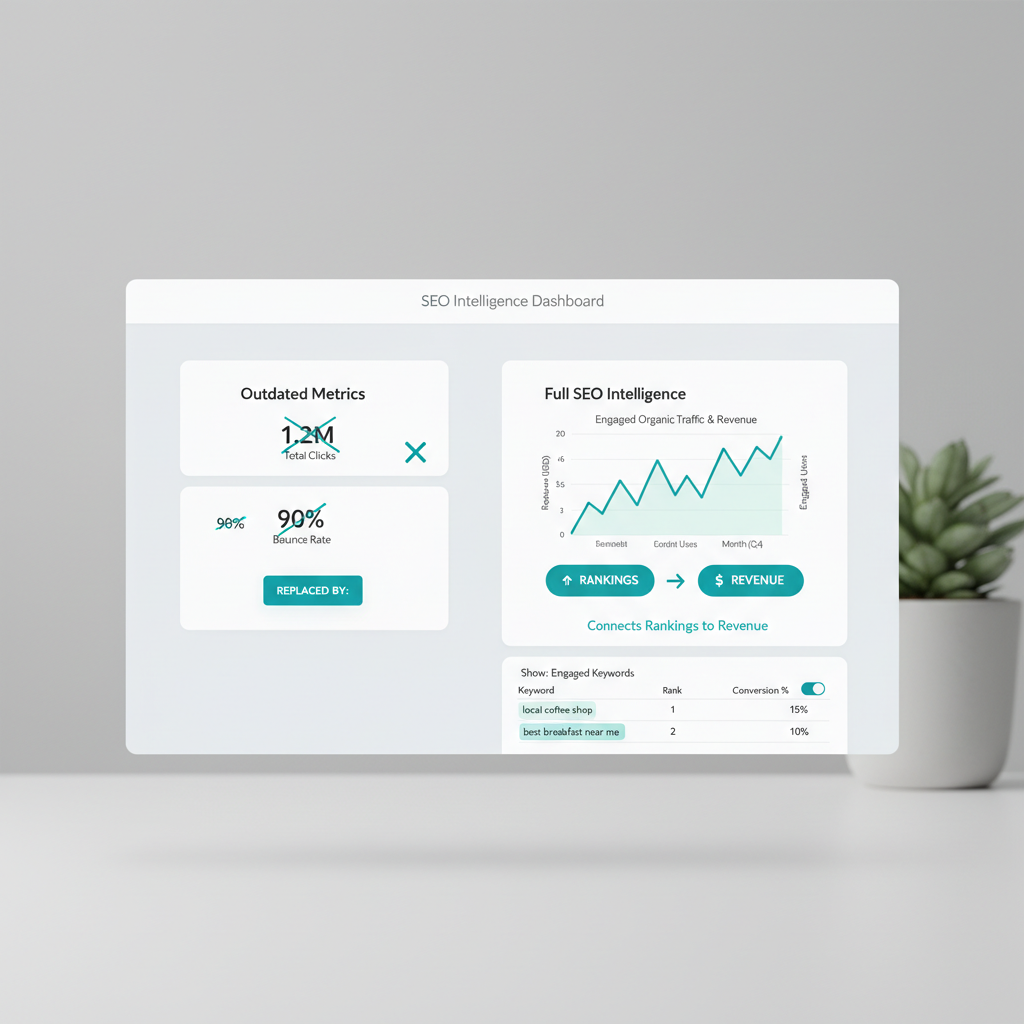
Raw domain authority and sitewide bounce rates should not be your main SEO targets. They describe broad conditions, not whether organic visitors find the right page or create revenue. A strong score can sit beside weak product pages and traffic that never converts.
Replace broad metrics with engaged organic traffic
Track what organic visitors do after they land. Useful signals include engaged sessions, scroll depth, form submissions, product views, demo requests, and purchases. These metrics show whether a page attracts the right audience.
Say a blog post ranks for a broad topic and earns thousands of visits. If those visitors leave without viewing a service page or starting checkout, the traffic has little business value. A smaller article that sends readers to a pricing page matters more.
GA4 custom channel groupings make this analysis useful. Build a grouping that separates organic search from paid search, referral traffic, email, and direct visits. Then break organic traffic into branded and non-branded searches or landing page types. Your report can show which groups produce engaged visits and sales.
Full SEO intelligence connects rankings to revenue
Full SEO intelligence means joining search visibility, page quality, visitor behavior, and business outcomes. It does not stop at rankings or backlinks. You also need to check whether the query matches the page and whether the next step supports your business model.
Use SEO analytics tools alongside Search Console and Analytics. Search Console shows queries, clicks, impressions, and landing pages. Analytics shows behavior and conversions. Each source covers part of the picture.
The useful question is not whether your authority score rose. Ask which non-branded queries brought engaged visitors to pages that generated pipeline. That shift helps you find real revenue drivers.
Your analytics platform may not answer that question by itself. Native tools often split data across reports and limit how you group search visits. GA4 also needs deliberate event setup before actions like quote requests appear as conversions.
That reporting gap can lead you to optimize what the platform displays easily. You may chase bounce rates while ignoring pages that attract high-value visitors.
Use a clear roadmap before adding more dashboards. This SEO strategy template connects keyword research, technical fixes, content planning, links, and measurement, so your SEO analytics reporting follows business priorities.
Keep vanity metrics as context, not targets. Domain authority helps compare competing sites, but it should not decide your next SEO task without revenue data beside it.
Building multi-source dashboards with Real-time SEO reporting
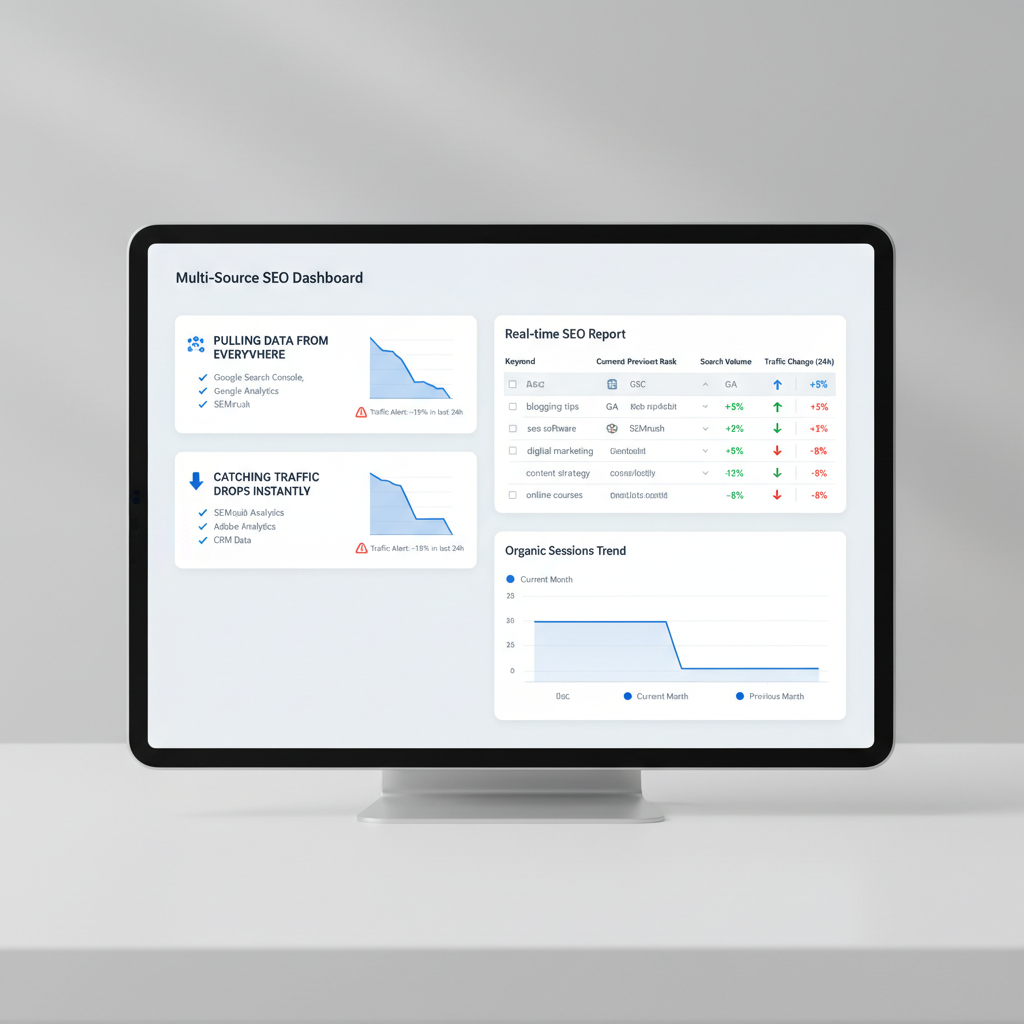
Jumping between five browser tabs to check metrics wastes hours every week. You fix this by building a central command center that pulls performance numbers into one executive view. This approach stops endless scrolling and gives stakeholders a clean snapshot of traffic, conversions, and ranking shifts.
Pulling data from everywhere
You bridge the gaps between disparate data sources by setting up automated connectors. Using tools like DashThis helps pipe raw metrics straight from Google properties into your dashboard canvas. Instead of manual CSV exports, data flows automatically from Search Console and Analytics on a scheduled basis. You map metrics like organic clicks, impressions, and goal completions side by side with paid channels so leadership sees the full picture instantly.
Catching traffic drops instantly
Waiting until the end of the month to review performance means you miss algorithm hits. Real-time SEO reporting tracks daily movement against historical baselines. When organic traffic dips past a specific threshold on a core landing page, automated alerts fire off to your team chat channel. You spot technical errors within hours instead of weeks, letting you investigate server logs before revenue takes a hit.
Managing the real costs
Building these pipelines sounds great on paper, but setup friction and ongoing maintenance costs are very real. APIs break when platforms update their schemas, and broken fields mean blank charts right before executive meetings. You need someone on your team to monitor data streams, fix connector auth tokens, and rebuild queries. That operational overhead eats into team capacity, so you must weigh the time savings of automation against the cost of keeping the plumbing intact.
Uncovering hidden SEO opportunities and link analysis insights
Finding hidden growth paths starts by pulling every rank your domain holds. When you pull unlimited SEO keyword ranking data, you stop guessing what works and start seeing long tail terms driving actual traffic. Export your rank tracker data into a spreadsheet to filter out terms stuck on page two. That specific cluster of keywords sitting between positions 11 and 20 represents your fastest path to new traffic without writing a new page.
Fixing internal page conflicts requires a strict cannibalization audit. When two URLs on your domain fight for the same query, search engines split authority or rank the wrong page. Pull your performance metrics to spot queries where multiple URLs trade impressions week over week. Merge those competing pages or rewrite one of them to target a different subtopic.
Auditing backlink profiles
Evaluating inbound links reveals why a competitor outranks you for tough commercial terms. Use a robust link analysis tool to check referring domains for toxic patterns or sudden drops in authority. Look closely at your anchor text distribution to make sure you do not rely too heavily on exact match commercial phrases. If your brand relies on automated workflows to scale content, read this guide on AI SEO Automation: How to Build a Search Engine That Compounds | Seobase for ways to build durable topical authority.
Spotting data sampling traps
Large enterprise websites face a hidden trap when pulling traffic data at scale. Platforms often rely on data sampling when your site pulls millions of rows, meaning your reports miss rare long tail queries. Switch your data views to raw unsampled exports or use the official API directly to prevent missing crucial ranking shifts. Real operators check query volume against server log files to verify traffic trends.
Connecting organic traffic directly to pipeline conversion value
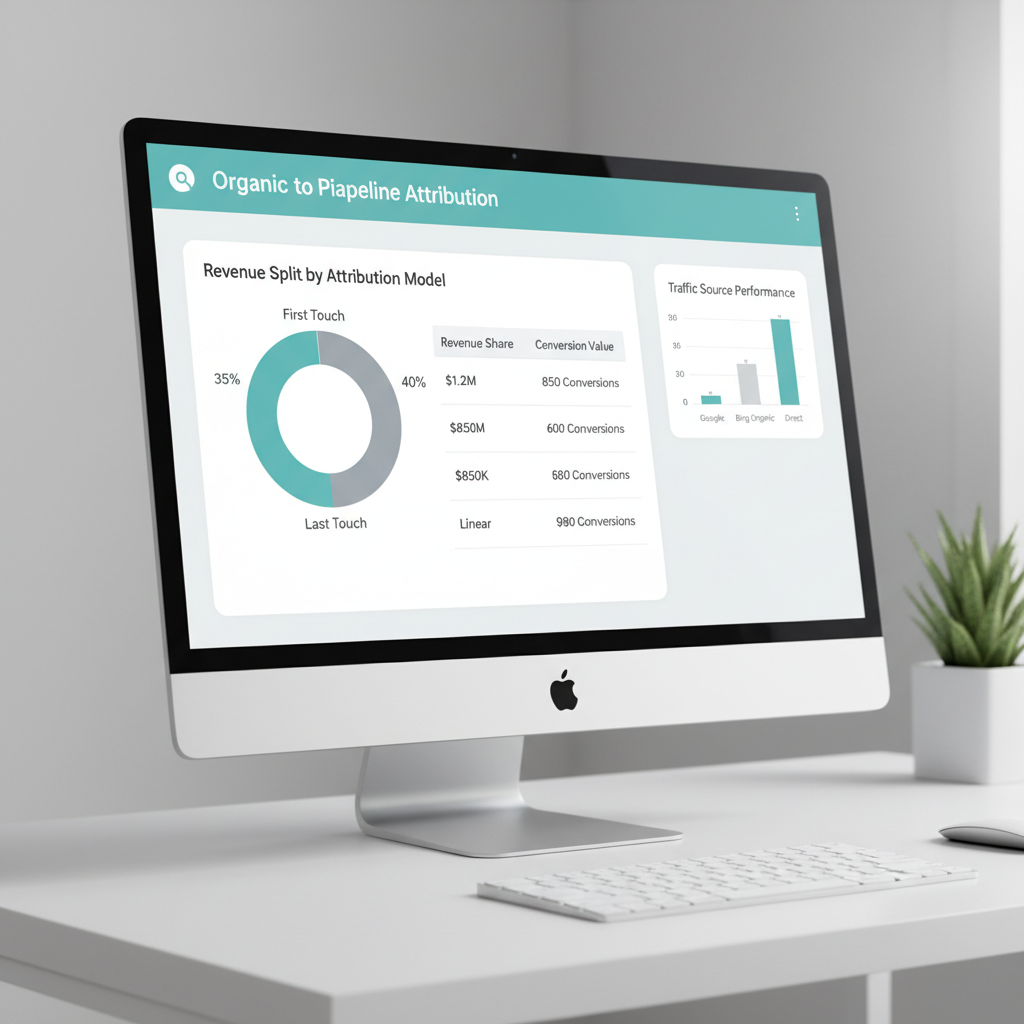
Assigning real revenue to organic search starts by pulling transaction data straight into your tracking software. Standard setups only show form fills, but advanced teams map closed deals back to the exact search query. You need organic conversion value tracking configured inside tools like Analytics to pass monetary amounts alongside each goal completion. When a lead buys an enterprise package, that exact figure must attach to the initial organic landing page.
Most buyers touch your site multiple times before they buy. First-click attribution gives all the credit to the blog post they found on day one, while last-click blames the final branded search. Neither approach tells the truth about your pipeline. You fix this blind spot by applying multi-touch attribution models that divide credit across every page view in the journey. A visitor might read three technical guides before requesting a demo, and each piece of content deserves a fraction of that final revenue number.
Long sales cycles break standard reporting because deals take months to close. B2B buyers read whitepapers, leave, and return through different channels weeks later. To capture these delayed conversions, you must connect offline CRM data to your web analytics. This is where specialized platforms help teams track long loops, and you can review options on the market by checking out the 8 best SEO tools for b2b in 2026 to scale SaaS visibility to see how modern suites handle data blending.
Server logs reveal what search engine crawlers actually do on your site, far beyond what basic pixel trackers catch. Setting up log file analysis integration lets you match bot crawl frequency against real revenue pages. If crawlers spend time on low-value archive pages instead of high-converting product hubs, your pipeline suffers.
How attribution models split revenue
| Attribution Model | Best Used For | What It Ignores |
|---|---|---|
| First-Touch | Brand awareness campaigns | The pages that actually close deals |
| Last-Touch | Short transactional funnels | The content that started the relationship |
| Linear | Multi-step B2B research paths | Which touchpoint drove the most persuasion |
| Time-Decay | Medium-length SaaS cycles | The initial discovery catalyst |
Tying search metrics to actual dollars changes how you plan content. Instead of chasing raw pageviews, you optimize for terms that attract buyers with budget. When your dashboard shows that a single keyword generated significant closed revenue, funding that content topic becomes an easy call for leadership.
Streamlining your analytics workflow for compounding organic growth
Stop obsessing over total traffic spikes that bring zero dollars to your bank account. Real growth happens when you shift your SEO analytics reporting away from empty vanity metrics and toward actual revenue. If a surge in monthly visitors does not move the needle on your pipeline, those traffic numbers mean very little. Tie your keyword research directly to commercial intent so you attract buyers instead of casual browsers.
Cut down tab clutter and stop living inside a messy web of disconnected manual spreadsheets. Maintaining separate sheets for rank tracking, traffic, and link acquisition wastes hours of valuable time every week. Pull your data into a unified automated dashboard instead. You can connect platforms like Seobase alongside Analytics and Search Console to feed all your numbers into one central view. That automation frees you up to act on the data rather than spend all day formatting cells.
Build your next progress report around assisted conversions rather than relying solely on last-click attribution models. Organic search rarely closes the deal on the very first visit. People often discover your site through informational queries, leave to think, and return days later to buy. When you track how your content assists those final sales, you stop cutting high-value pages just because they lack direct conversions.
Ditch the old habit of hoarding fragmented tracking documents. Pick one primary revenue goal for your next review cycle and build your workflow around it. Open up your main interactive SERP intelligence tool, pull your current performance numbers, and delete every extra tracking spreadsheet you have not used in the last month.
Your single next action is to build one automated analytics dashboard today and schedule your next performance review around assisted revenue. Stop building custom files from scratch. Let software handle the data collection while you focus entirely on execution.
Frequently asked questions
What metrics actually matter in an SEO analytics report?
Focus on engaged organic sessions, conversion rates, assisted conversions, and targeted keyword visibility rather than vanity metrics like raw domain authority or high bounce rates. These metrics connect search performance directly to your actual business revenue and pipeline growth.
How do you automate SEO reporting across multiple tools?
You can automate reporting by using dashboard platforms like Looker Studio, DashThis, or Supermetrics to pull data from Search Console, Analytics, and other data sources into a single, unified view that updates in real time.
What is the difference between Google analytics and Google search Console in reporting?
Google Search Console tracks search engine visibility, impressions, clicks, keyword positions, and technical crawl errors. In contrast, Google Analytics measures user behavior, engagement rates, session paths, and conversion actions once users arrive on your site.
Why should ranking positions not be the sole KPI of SEO performance?
SERP volatility, featured snippets, and AI overviews mean high keyword rankings do not always translate to actual clicks, traffic, or revenue. Focusing solely on a ranking position ignores user intent and actual on-site engagement.
What is the role of Multi-touch attribution in SEO reporting?
Multi-touch attribution models help identify how organic search assists conversions across multiple touchpoints rather than just giving credit to the last click, offering a much more accurate picture of SEO value.
How often should SEO performance reports be shared with stakeholders?
High-level summary reports focusing on revenue, conversions, and pipeline value should be shared monthly with executives, while detailed operational and technical reports can be reviewed weekly by the marketing team.
Put this on autopilot
Seobase runs the whole loop for you: it finds the keywords worth ranking for, writes and publishes the articles, and reports back from Search Console on what actually moved.
Start a free Seobase workflowIn this guide
- Cutting vanity metrics to focus on Full SEO intelligence
- Building multi-source dashboards with Real-time SEO reporting
- Uncovering hidden SEO opportunities and link analysis insights
- Connecting organic traffic directly to pipeline conversion value
- Streamlining your analytics workflow for compounding organic growth
- Frequently asked questions